
Globally, runners in timed mass participation running events have never been slower – shows a recent study covering 107.9 million race results from more than 70 thousand events between 1986 and 2018.
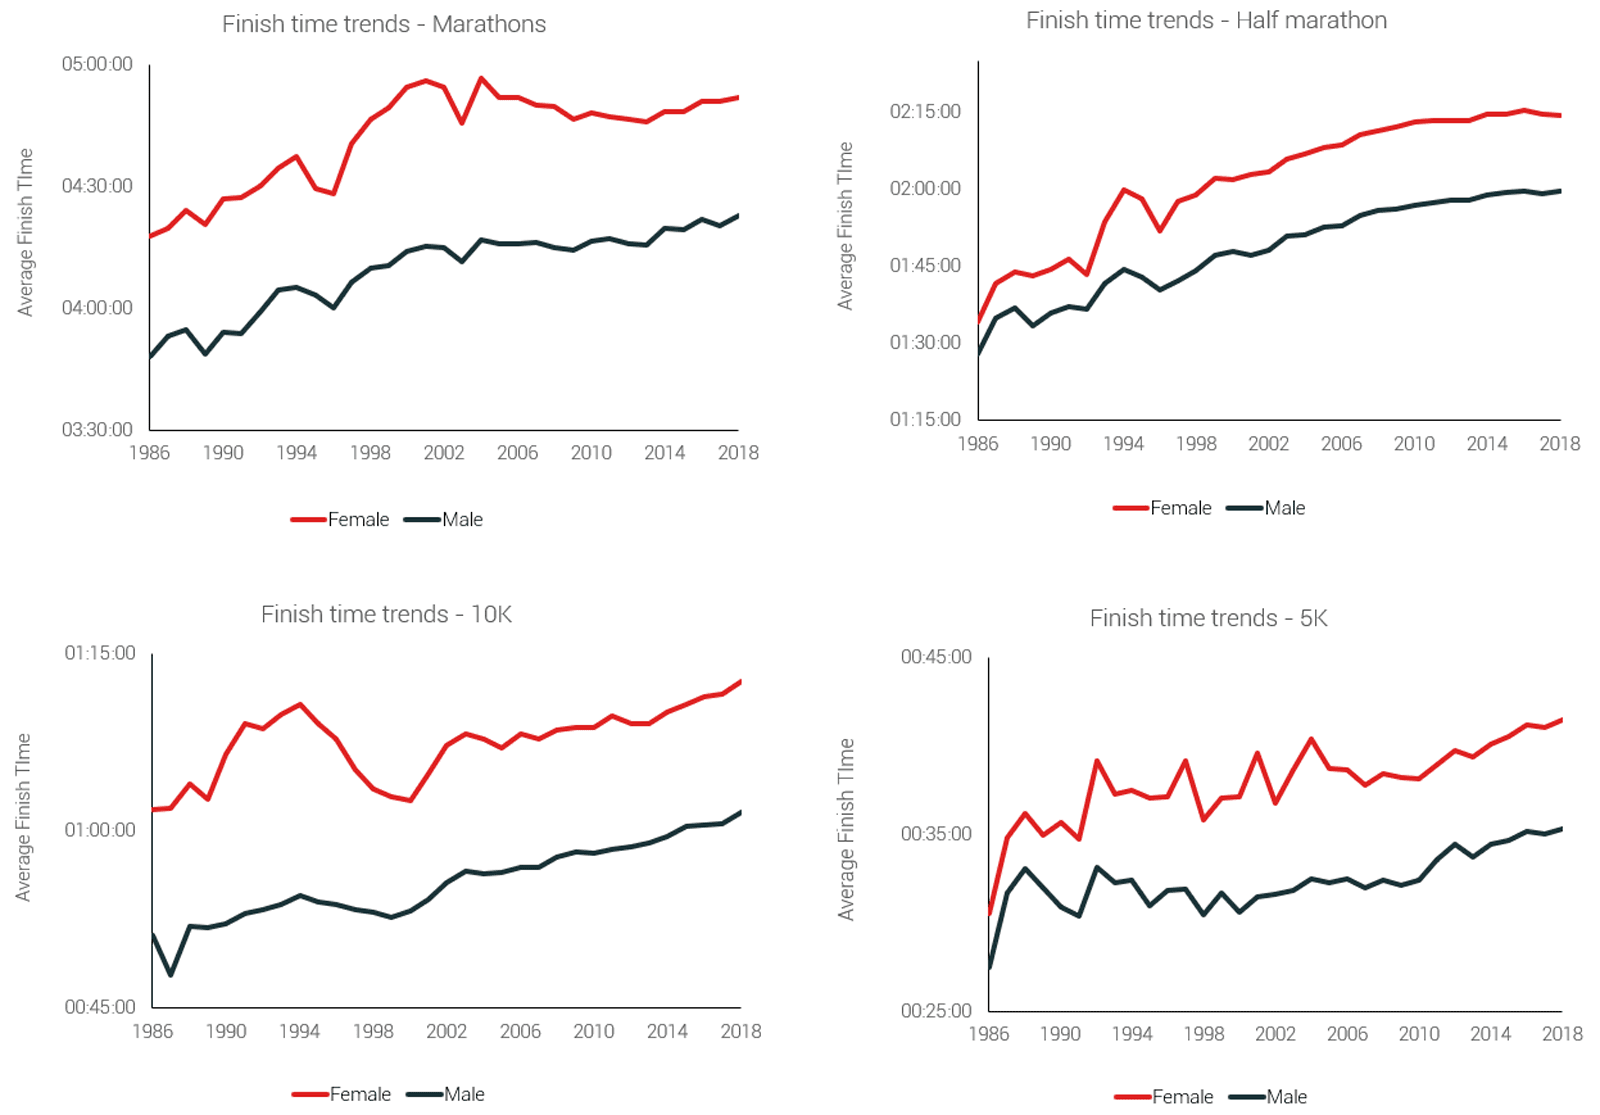
In 1986 the average finish time for a Full Marathon was 3:52:35, whereas today it’s 4:32:49 – a slowdown of 40 minutes and 14 seconds. But the rate of slowing has itself been decreasing since 2001. A similar trend can be seen across all the four common running distances (Full Marathon, Half Marathon, 10K and 5K).
A breakdown by gender shows that men are continuously slowing over the years. On the other hand, women were slowing down faster than men between 1986 to 2011, but after that have actually become faster.
SEA countries are the slowest across all distances
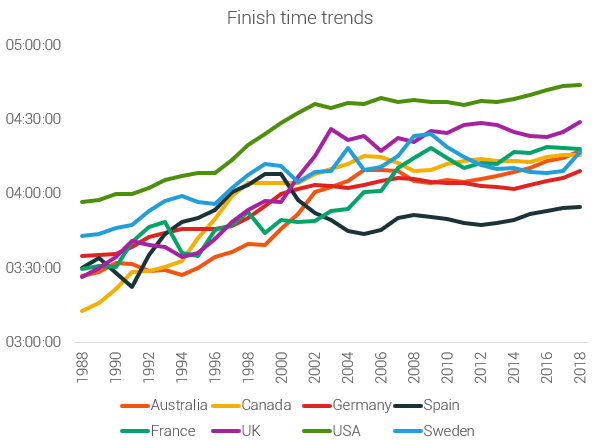
The United States is the country with the most runners in the world, but from the countries with most participants (plotted below), it has consistently been the slowest. Spain, on the other hand, has consistently been the fastest marathon nation from 2002 onwards.
When it comes to finishing times, SEA countries rank consistently in the bottom places across all distances, as shown below.
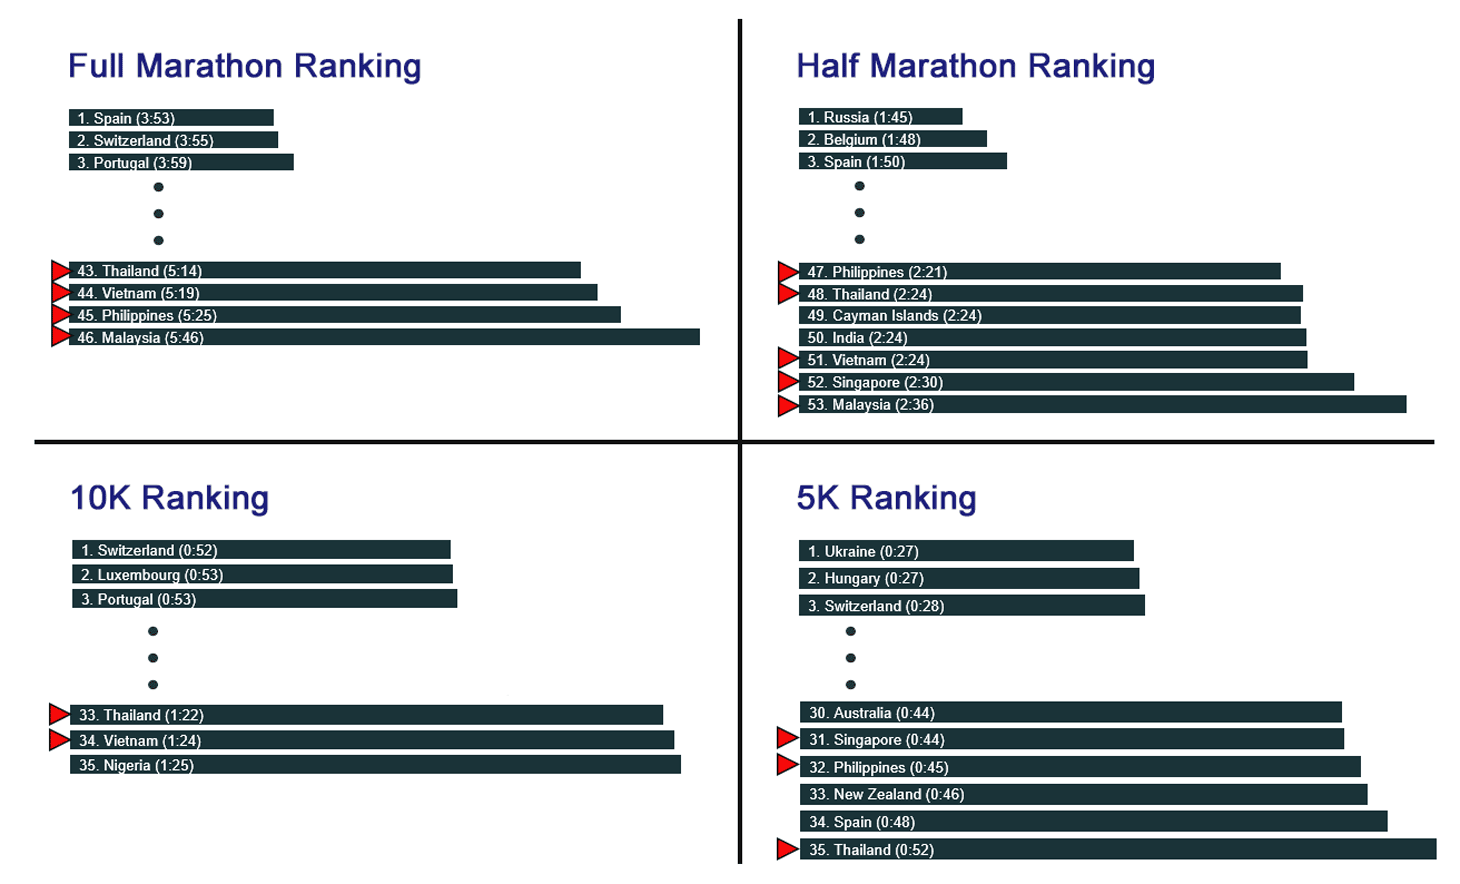
(For a chart that includes more APAC countries, click here)
Malaysia is the slowest Marathon and Half Marathon nation. This is a worrying fact when seen in correlation with indications that over 51.32% of Malaysians lack motivation to exercise. Thailand has the slowest 5K timing, and, unfortunately, is the country that during the past 10 years has slowed down the most on the 10K.
But are SEA runners really the slowest in the world?
Before we jump into any conclusions, let us consider a couple of things.
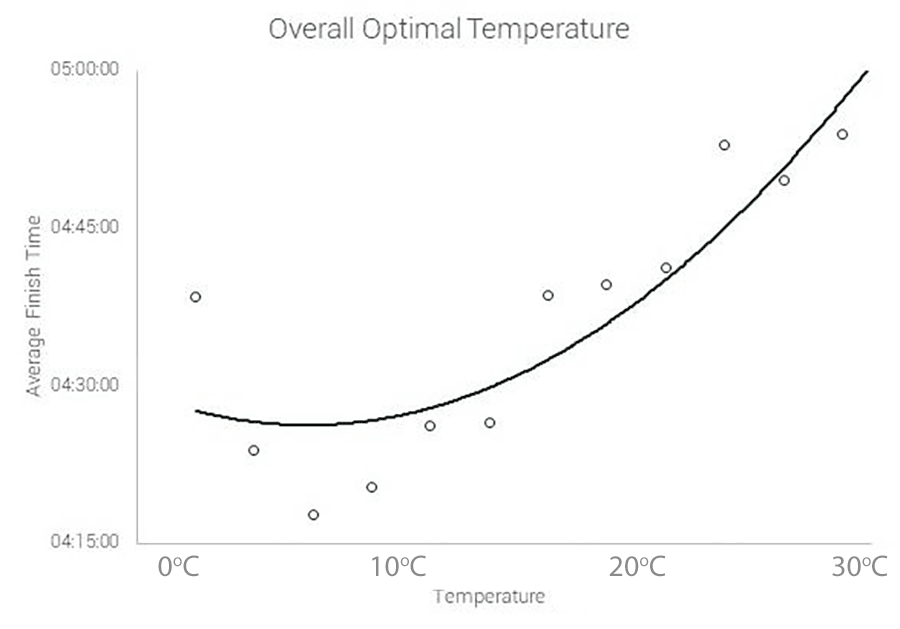
First, it is known that the optimal running temperature is around 5°C. Temperatures of that sort will never be seen in our region. Here in SEA, runners have to routinely face 30°C+, not to mention the notoriously high levels of humidity.
Therefore, a correction on the finishing times could be attempted based on the graph below which shows that finishing times for the Full Marathon are expected to be up to 30 mins slower, due to temperature differences alone. This would bring SEA countries a couple of positions higher, and much closer to the world’s mean finisher times.
Second, participation in running events in Asia is still on the rise, seeing a 24.54% year-on-year growth, in contrast to the slowdown observed in the rest of the world since 2016. It is therefore expected that as race attendance is increasing in the region, the timings of the new, inexperienced and casual participants will blend with that of competitive runners, making the overall timings averages appear slower.
A paradigm shift: From competition to experience
Asia clearly prefers shorter-distance races. We used JustRunLah!‘s Race Database to filter events between 1 January 2018 and 31 December 2019. We found a total of 1332 5K and 900 10K races, considerably more than the 499 Half Marathons and 288 Full Marathons that took place in the same time frame. Such shorter-distance events are usually targeted at recreational runners and tend to attract less competitive runners.
Therefore, it is the increased exposure of the sport, coupled with the plethora of themed runs and family-oriented events that have brought in a totally new group of participants. These new participants are driven by motives very different from those of the traditional competitive runners – be it the runner’s entitlements (goodie bag), brand association, charity support, or just FOMO (fear of missing out). This is backed by trends that show more people traveling overseas to attend races as well as community surveys.
All things considered, the motives for participation seem to be changing from being achievement-focused to being phycological, health- and socially-focused. And races are increasingly being seen as lifestyle events instead of competitions. It is expected that the average times will appear to be slower – unless corrections or segmentations are applied to the data – considering the influx of casual runners.
Data and methodology (for the geeks)
- Data from “The State of Running” (https://runrepeat.com/state-of-running). Adapted and reprinted with permission.
- Elite runners have been excluded and thus this is an analysis of recreational runners.
- Walks and “walk/run for charity”-events have been excluded as well as obstacle course races and other non-traditional running events
- The study was done in collaboration with the International Association of Athletics Federations (IAAF) and presented in China in June 2019.
- Data collection was done through databases of race results as well as individual Athletics Federations and races sharing race results.
- 107.9 million race results, 70,000 events, from 1986 to 2018
Thanks to Jens Jakob Andersen from RunRepeat.com